Sales have caught up to last year and should continue going up.

The region closed over 5,100 sales last quarter and the highest quarterly total in at least 20 years, going back as far as we have data. That represented a 10% increase over last year’s third quarter, and a whopping 87% over the COVID-depressed second quarter.
Pending sales promise record closings in the fourth quarter.
Pending sales in the third quarter were up 57% overall from last year’s third quarter and up dramatically in each month within the quarter: rising 59% in July, 51% in August and 61% in September. This surge has now driven pending sales up 10% from last year, which is amazing considering the challenges the market faced during the spring –and still faces today.
Why are sales up? Part of it is just the existing demand that was suppressed during the second quarter when sellers didn’t want to put the homes on the market, buyers didn’t want to go look and agents were largely restricted from even showing properties. Even with the economic disruptions by the pandemic, that buyer demand didn’t go away- it came roaring back in June once the crisis eased a little.
We also saw a dramatic increase in demand coming out of New York City, with buyers migrating to the suburbs in search of bigger spaces. Without question, the city’s loss has been the suburbs gain, with a tremendous influx of buyers- especially at higher price points within each county.
Listings are up from the second quarter but inventory is still low.
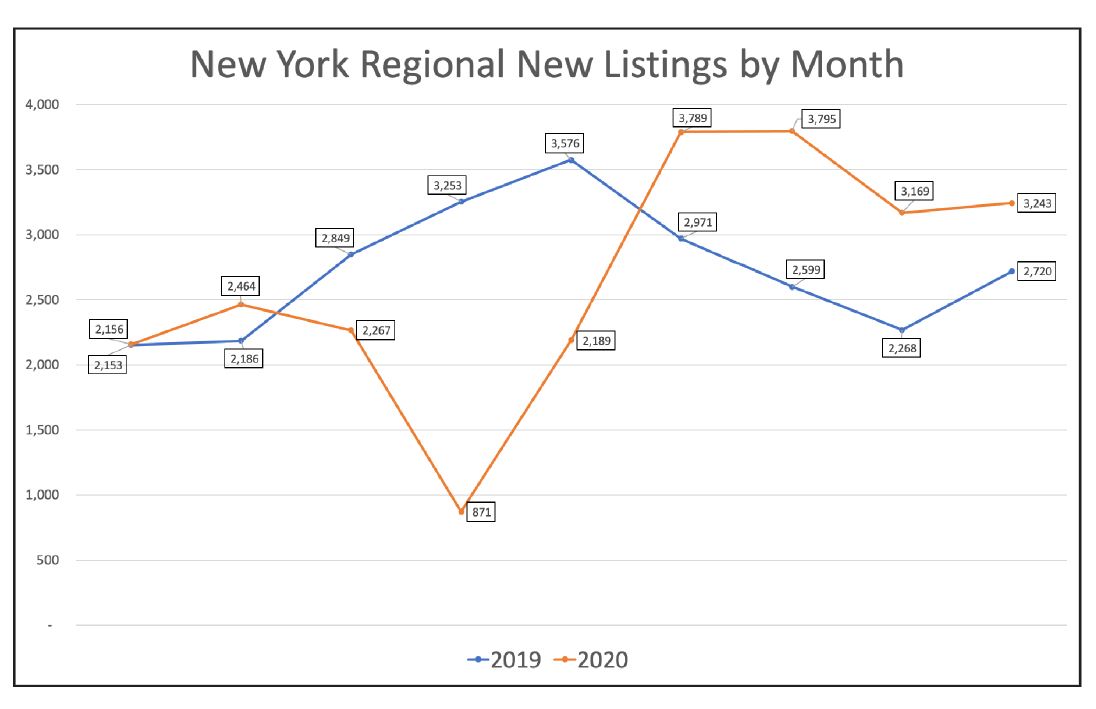
Listings were down over 30% during the second quarter but roared back in the third quarter – rising almost 35% compared to last year. Listings are now down only about 3% compared to 2019. We expect listings to overtake last year’s pace by the end of the year, since many homeowners will be tempted to put their homes on the market when they see how sharply prices are rising.
But even with listings up over the past few months, inventory is still down. Why? Because pending sales are up so sharply from last year. Its simple math: with pending sales up 57% that 35% increase in listings is not sufficient to satisfy the existing levels of demand. We are simply selling more homes than are coming onto the market.
We measure “inventory” by calculating how long it would take to sell out the existing number of homes for sale, at the current rate of sales per month. Anything below six months of inventory usually signifies a seller’s market. And for the region, most of the markets are below 5 months of inventory. This kind of shortage is going to continue to drive prices up until economic equilibrium sets in, bringing more listings to the market.
Prices are up sharply across the board.
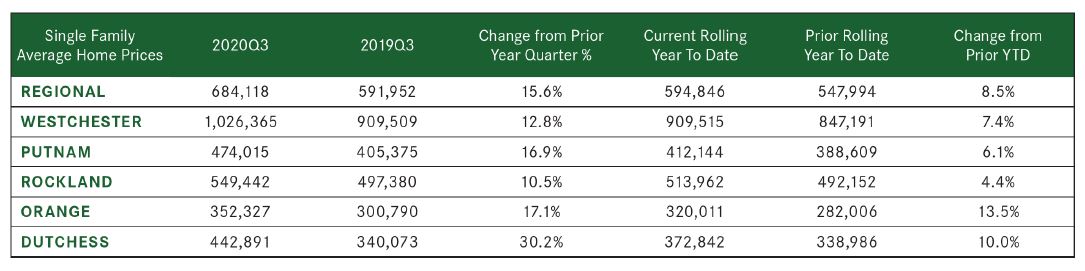
Prices spiked in the third quarter, continuing a trend that started developing in the pre-COVID first quarter but has accelerated during the pandemic. Single-family home prices were up in every county in the region, rising a whopping 16% from the last year’s third quarter- the largest quarterly increase in at least 20 years.
So what’s driving the spike in pricing? Some of it is legitimately organic, sustainable appreciation coming from increases in buyer demand, both from local buyers and those urban exiles who are migrating out of New York City. We don’t know if that surge in demand is sustainable but it’s certainly contributing to these price increases right now.
All that said, some of this appreciation is sustainable. If you look at the rolling year price increase, for example, they averaged almost 9% for the region and were up in every single-family market. That’s a long-term trend that we expect to continue through next year.
What to expect next:
Going forward, we are optimistic that the housing market will continue to grow through the fourth quarter. Plus interest rates remain historically low which should also boost buyer demand. Accordingly, we expect a significant increase in sales and prices through the end of the year, and into 2021.


Sorry, the comment form is closed at this time.