SALES WERE DOWN, BUT ONLY BECAUSE OF PANDEMIC RELATED DISRUPTIONS.
Sales were down sharply for the quarter, falling 23% for the region and down in every county. Over the rolling year, the results were not as dire, with sales down only 2.7% ‐ reflecting how strong the market had been going into March.
That quarterly number would normally be cause for alarm, but given the pandemic‐related challenges, we were actually impressed that the results were that close to 2019. The fact that the closings were only down 23% was a testament to industriousness and creativity of the professionals involved in the closing process: not just the real estate agents but the attorneys, lenders, title agencies, insurance companies and municipal offices.

PRICES WERE UP, REFLECTING CONTINUED STRONG BUYER DEMAND.
Prices were up sharply in the second quarter, rising 5.6% for the quarter and 3.1% for the rolling year, and up in just about every county in the region. Indeed, the quarterly average sales price for the region reached its highest level since the third quarter of 2007, at the very tail end of the last seller’s market.
Part of this increase was the natural result of high levels of demand, low interest rates and depleted inventory. But we should also caution readers that we believe part of it comes from an artificial boost in higher‐end sales during the pandemic. Why? Because people buying expensive homes in the market are generally more likely to have the means to close during these challenging times. Thus, we might be seeing a boost to pricing from a heavier mix of higher priced properties.

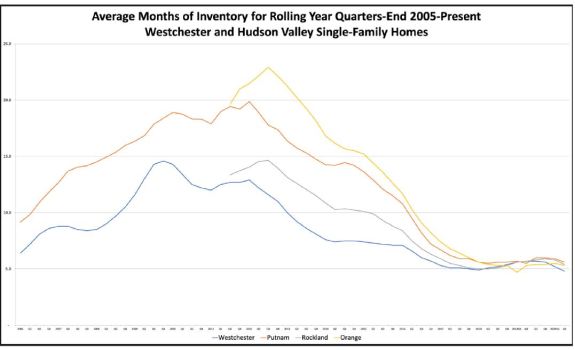
INVENTORY IS WAY DOWN, AND MAY BE EVEN WORSE THAN IT LOOKS.
Inventory was way down throughout the region. We measure inventory by calculating how long it would take to sell out the existing number of homes for sale given the average number of homes sold per month. Generally, six months of inventory is considered average: anything lower, and you’ll usually see multiple offer situations and bidding wars. Right now, inventory in most of the markets in the region is well below that six month level, mostly because of the severe shortfall of listings in April and May.
Indeed, we think the inventory shortage is more serious than that, because the average number of homes sold per month include a couple of very weak months in the second quarter. Most likely, buyer demand in the third quarter will be a lot higher, and we may not have enough listings to satiate that demand. The market needs more listings!
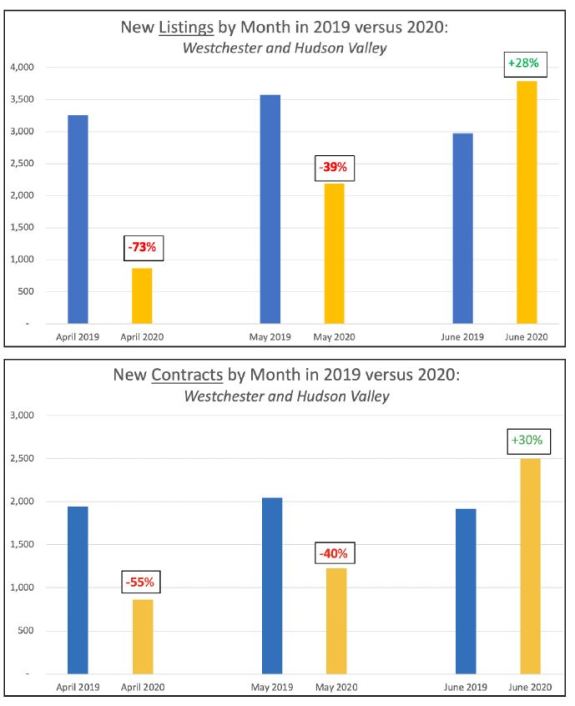
JUNE BUYER AND SELLER ACTIVITY WAS SHARPLY UP.
Once the public concerns about the pandemic and the essential services order eased up a bit in June, the housing market really took off. Although sales activity would not yet show the bump, since it takes time to get deals from contract to closing, the “leading indicators” of new listings and deals in contract spiked dramatically from last year’s numbers. Specifically, compared to last year, regional listings were up over 28% and new contracts were up over 30%. We believe this is a clear sign of things to come in the second half.


Sorry, the comment form is closed at this time.